Thursday, 8 May 2014

Alteryx 9.0 is released!

April 24th saw the release of Alteryx 9.0.  Which is absolutely jam packed with fantastic new features and tools!  So many features in fact, that I'm not going to be able to cover all of them in a single article, but I will give you a brief tour of some of the highlights:

New Tools


This release sees a massive 38 new tools!  Helped in no small part by the new Analytic App authoring process.

Here they all are:


App and Macro Authoring Redesign


The App and Macro Authoring process has seen a complete overhaul this release and is one of my favorite new features.  The process is no longer hidden away on multiple properties tabs, but built up on the canvas using the new "Interface" tools.  Look out for more on this topic in a future blog post.

New Data Formats


As ever there are even more data formats supported this release including:

  • SAS data files (.sas7bdat)
  • SPSS data files (.sav)
  • Output to QlikView data files (.qvx)
  • Read and write to Marketo
  • Read Google Analytics data
There are also four new social media connectors:
  • Twitter
  • Foursquare
  • Gnip
  • DataSift

Improved Download Tool


The download tool has had a lot of new features added this release and now should let you interface with any web API out there.

This is how the four new social media tools (which are in fact macros) work.  So if you want to see an example of the new download functionality in action, open up one of the social media macros and take a look.


Private Cloud Server


The private cloud version of Alteryx has seen a huge update this release.  Now you can get the functionality of the Alteryx public gallery on your own private server inside your firewall.  A fantastic way to deliver Analytic Applications and insights to your wider business.


That is a very quick round up of just some of the new features.  Look out for some more detailed blog posts on specific features over the coming weeks.


Friday, 10 January 2014

Gauge Macro

Gauge.yxmc


Download
Help


This is actually another old macro, but one which I never actually published on this blog.  It did however make a guest appearance in the Presidential Election App over on the Alteryx Public Gallery.


What Does it Do?


Well in that App it produces this part of the final report:

Showing the percentage of Republican or Democrat support for a given geographical area.  In general it produces a gauge giving a visual representation of a percentage field.  To use it you just add the macro to your canvas and give it some input data which contains a percentage field between 0 and 100.  For each row of your data it will generate a gauge visually showing the percentage.

You can also choose how big you want the gauge to be and customize the colors.


How Does it Work?


Now how it works it a little more interesting.  Does it use the work Ned has been doing on HTML visualizations? No.  Does it use the Run Command tool to call some external application to draw the gauge?  No.  It doesn't need to; we already have a tool in Alteryx which will let you draw things: The Report Map tool.  That's right the gauge and the arrow are actually a map!  Obviously not a map of anywhere physically, but made up of spatial objects created and manipulated by Alteryx and rendered by the Report Map tool.

Creating the spatial objects is the fun part and called upon some long ago learned trigonometry from my school days.  I'm not going to go into the exact details here, the macro is commented so download it and take a look at the details.

But I think you'll agree this opens up a whole world of creating custom reporting controls.  We are only limited by our spatial skills in Alteryx.


Improvements


One thing which could be better in the macro is the way you can choose colors.  At the moment you have to enter a hex format like #ff00ff.  Wouldn't it be great if there was a color picker question type that we could use in macros and apps?  How could I tell Alteryx what a great idea I think that would be I hear you ask?

Well that and any other great ideas that you have for product improvements to Alteryx can be submitted to the Alteryx Idea Center over at the Alteryx Community Site. (I would submit the idea myself, but feature requests carry more weight if they come from real customers ;-) )  But there are already some great ideas over there, so go join in the conversation!

Friday, 22 November 2013

Tableau Mapping Using Alteryx

Back in July Alteryx released Alteryx for Visual Analytics; a version of Alteryx Desktop specifically tailored
to deliver data natively to Tableau Software.  Since then I have begun to explore what Tableau is all about and in my opinion the two products are a beautiful pairing:  Alteryx allows you to do all of the preparation, heavy lifting, cleaning, blending and reformatting of your source data; and Tableau provides you with beautiful interactive visualizations and dashboards of that data.

One particular area that I looked into early on was the interactive mapping capabilities of Tableau.  You can create some great looking interactive maps in Tableau using a number of built in geocoding levels:


But what if your data isn't at one of those levels?  Well here I have to say a big thanks to +Craig Bloodworth a Tableau Zen Master from The Information Lab; a Tableau and Alteryx partner based here in the UK.  Craig has set up the website http://tableaumapping.bi/ where Tableau users can download spatial datasets for use in Tableau and he was kind enough to educate me in what format these files needed to be in.

Which for those of you interested is this:


Where each row is an ordered point in the outline of the polygon it is going to draw.  Effectively a dot-to-dot for Tableau to follow and render the polygons.

We quickly realized that creating this format using Alteryx would be straightforward using the spatial tools available and put together the below workflow to do just that:


Next step?  Wrap into a macro of course so we can reuse it time and time again by dragging a single tool to the canvas:


If you want the macro to use in your own modules you can download it here.

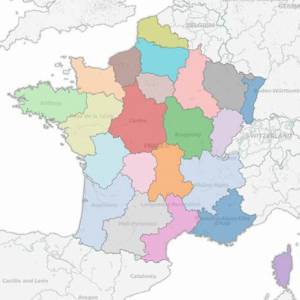
From there I decided it was time to contribute some mapping files to the site.  Using Wikipedia I quickly found a description of the Administrative Divisions of France and a quick Google search found an open source site where I could download the data (http://professionnels.ign.fr/geofla).  The only problem was that the site only contained four of the geographical levels listed on the Wikipedia page.  I was missing the highest geography level, Regions.  But the problem was quickly fixed when I realized the next level down (departments) included a region field, so I just used a summarize tool in Alteryx to summarize the departments into the Regions and problem solved:


From there it was just a case of selecting which fields I wanted on my output and getting the files off to Craig to publish.

On this coming Monday myself, Craig and +Allan Walker are challenging ourselves to see how many mapping datasets we can add to http://tableaumapping.bi/ in one day.  So if you have any requests for datasets you would like to see then let us know in the comments below or on twitter.  Follow our progress on Twitter during the day with the hashtag #tableaumapping.

Friday, 15 November 2013

Dynamic Formula Macro

DynamicFormula.yxmc

The Dynamic Formula Tool allows you to dynamically create formulas using a data feed. Effectively allowing you to write formulas by using other formulas, the summarize tool or other techniques. Great for when you need to write a long or complex formula or create a lot of formulas and don't want to do it manually.

Download
Help

What Does it Do?


Ever wanted to generate formulas using formulas?  Then the Dynamic Formula macro might be just what you are looking for.

How Does it Work?


First released on this blog back in May 2010 http://www.chaosreignswithin.com/2010/05/dynamic-formula.html; that blog post provides some more background to the tool.  This release sees the module upgraded to horizontal layout and makes use of some of the new Alteryx features that have been added since it was first written:

EscapeXMLMetacharacters()


This new method is ideal for when you are building your own XML as it correctly escapes the XML meta characters.Which are " ' < > &.

So now the tool can dynamically build formulas with greater than or less than comparisons.

Output fields change based on the data input into the macro


This is a new check-box on the macro properties window and the dynamic formula macro is a perfect example of what it is for.  So at configuration time we don't know what fields will come out of the macro because the field names of the new fields are determined by the data that is input into the bottom input.  Without this check-box checked the macro forgets what fields it is outputting whenever the module config is refreshed.  With it checked then after the first run it remembers its output fields, which is exactly what you want.

Dynamic Replace Tool


It is also worth mentioning that since I originally wrote this macro the dynamic replace tool has appeared in the Tool Palette, which with a bit of manipulation I believe can be made to perform the same functionality as this macro.  However I still like the Dynamic Formula for its simplicity.


Tuesday, 12 November 2013

Another New Alteryx Blog

As if one new Alteryx blog (inspiringingenuity.net) wasn't enough, there is now another Alteryx themed blog by no other than the reigning Alteryx Grand Prix Champion - Chris Love.

Check it out here http://sciolisticramblings.wordpress.com.

His latest blog post creates a bi-variate themed map macro using some great custom XML manipulation.


He also has some great posts on:
The interactive maps post makes use of some of the experimental work that Ned Harding (Alteryx's CTO) has being doing over on his blog around interactive charting.  If you haven't been following these posts I would highly recommend that you take a look.  He is just wrapping the series up so a great time to read the whole lot at once. http://inspiringingenuity.net/2013/11/11/alteryx-a-reusable-nvd3-macro/

Look out for a macro from me using some of his techniques coming soon...


Friday, 4 October 2013

Macros - Version

Before starting this post on the Version macro I would like to share with you a new page which I have added to the blog which will contain a consolidated list of the macros which I have built and published here. It is easily accessed from the Macros link on the menu bar above.

And the first macro to be released to that page is the Version macro:

Version.yxmc

This macro can be embedded into other macros to allow checking of the version against an XML file stored on the web.

Download
Help


What Does it Do?


I had the idea for this macro several years ago and actually presented it at the developer part of the Inspire conference in 2012.  But it never actually made it to this blog until now.

The idea behind the macro is that it allows other macros to be versioned and to check against a web page to see if there is a newer version available.  Now my initial plan was that this check would be done every time the macro that used it was run.  Unfortunately downloading the web page that contains the versioning information, while not terribly slow (a few seconds), is slow enough that I don't want to do it every time one of my macros is used.  I think this limitation is some of what stopped me posting this macro until now.

So in the released version of the macro I have come up with a compromise.  The macro is embedded in other macros as intended, but by default it does nothing. (All of its tools are disabled by a tool container).

Usage by End User


Here it is being used in the Dynamic Formula macro:


Then when a user wants to check that their macro is up to date they:


  1. Open the macro they want to check
  2. Click on the version macro
  3. Check the Check Box to enable checking (see screenshot right)
  4. Run the module.


They then get messages in the log which tells them if the macro is the latest version available:


or a message telling them I have released a new version:


Usage by Macro Developer


If you would like to use this in your own macros then feel free.  To set it up you just drop it into your macro, point it to an XML file you have hosted somewhere on the web and enter the version number to match the version number in your XML file.  The XML file needs to look like this:


You can copy the example here: versions.ChaosReignsWithin.com\Example.xml

Then when you update your macro in the future, you just need to bump up the number in the version macro and in the XML file and include whatever message you would like to tell your users in your XML file.  Then anyone who has an old version of your macro and checks for updates will get your message.

How does it work?


The module is fairly simple


The two text inputs on the left get updated from each of the two questions in the macro and the tool container which contains the whole module gets enabled/disabled by an action which is fed by the check box.

From there:
  • A download tool grabs the XML from the web
  • We use an XML parse tool to digest the XML
  • A join tool brings in the version number from the parent macro
  • We then compare the versions and use a series of message tools to display the various messages to the end user.