 Back in July Alteryx released Alteryx for Visual Analytics; a version of Alteryx Desktop specifically tailored
to deliver data natively to Tableau Software. Since then I have begun to explore what Tableau is all about and in my opinion the two products are a beautiful pairing: Alteryx allows you to do all of the preparation, heavy lifting, cleaning, blending and reformatting of your source data; and Tableau provides you with beautiful interactive visualizations and dashboards of that data.
One particular area that I looked into early on was the interactive mapping capabilities of Tableau. You can create some great looking interactive maps in Tableau using a number of built in geocoding levels:

But what if your data isn't at one of those levels? Well here I have to say a big thanks to +Craig Bloodworth a Tableau Zen Master from The Information Lab; a Tableau and Alteryx partner based here in the UK. Craig has set up the website http://tableaumapping.bi/ where Tableau users can download spatial datasets for use in Tableau and he was kind enough to educate me in what format these files needed to be in.
Which for those of you interested is this:

Where each row is an ordered point in the outline of the polygon it is going to draw. Effectively a dot-to-dot for Tableau to follow and render the polygons.
We quickly realized that creating this format using Alteryx would be straightforward using the spatial tools available and put together the below workflow to do just that:

Next step? Wrap into a macro of course so we can reuse it time and time again by dragging a single tool to the canvas:

If you want the macro to use in your own modules you can download it here.
From there I decided it was time to contribute some mapping files to the site. Using Wikipedia I quickly found a description of the Administrative Divisions of France and a quick Google search found an open source site where I could download the data (http://professionnels.ign.fr/geofla). The only problem was that the site only contained four of the geographical levels listed on the Wikipedia page. I was missing the highest geography level, Regions. But the problem was quickly fixed when I realized the next level down (departments) included a region field, so I just used a summarize tool in Alteryx to summarize the departments into the Regions and problem solved:

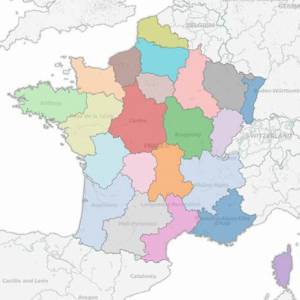 From there it was just a case of selecting which fields I wanted on my output and getting the files off to Craig to publish.
On this coming Monday myself, Craig and +Allan Walker are challenging ourselves to see how many mapping datasets we can add to http://tableaumapping.bi/ in one day. So if you have any requests for datasets you would like to see then let us know in the comments below or on twitter. Follow our progress on Twitter during the day with the hashtag #tableaumapping.
No comments:
Post a Comment